


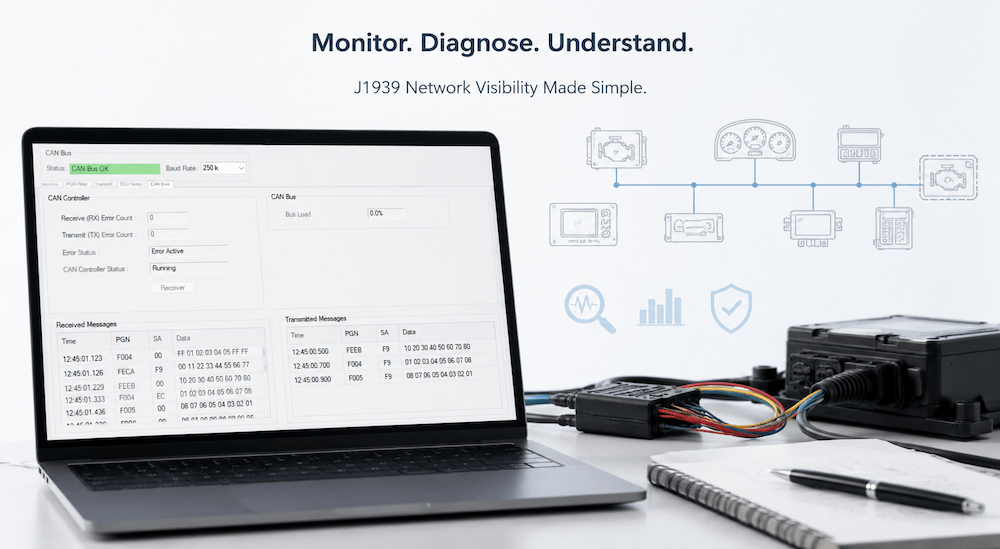
I have finished the latest update to the JCOM1939 Monitor for Windows. The release adds two features I’ve wanted to have on the bench: a live view of the CAN Bus network condition, including receive/transmit error counters and a Silent Mode for recording traffic without transmitting. The diagnostics grew out of a customer question about J1939 frames that appeared to go missing during a test.
CAN bus status at a glance
The customer was transmitting identical PGNs from two nodes. I couldn’t reproduce the missing frames on my bench, but the test raised a practical question. If an expected frame never appears in the monitor, did the CAN controller encounter an error, or do I need to look more closely at what the ECU sent and how the Windows application handled it?
Note: Two or more J1939 nodes can technically broadcast the same PGN as long as they use different source addresses. Doing so, however, goes against an unwritten convention that a given broadcast PGN should originate from a single dedicated node. A receiving node should never have to rely on the source address to determine which broadcast message to use. When communication needs to take place between specific nodes, that’s what peer-to-peer messages are for.
The update puts a CAN bus condition indicator at the top of the main window. It shows green for normal communication, orange for communication issues or degraded communication, and red when communication is lost.

A dedicated CAN Bus tab shows the receive and transmit error counters, the controller’s error and operating status, and the current bus load.
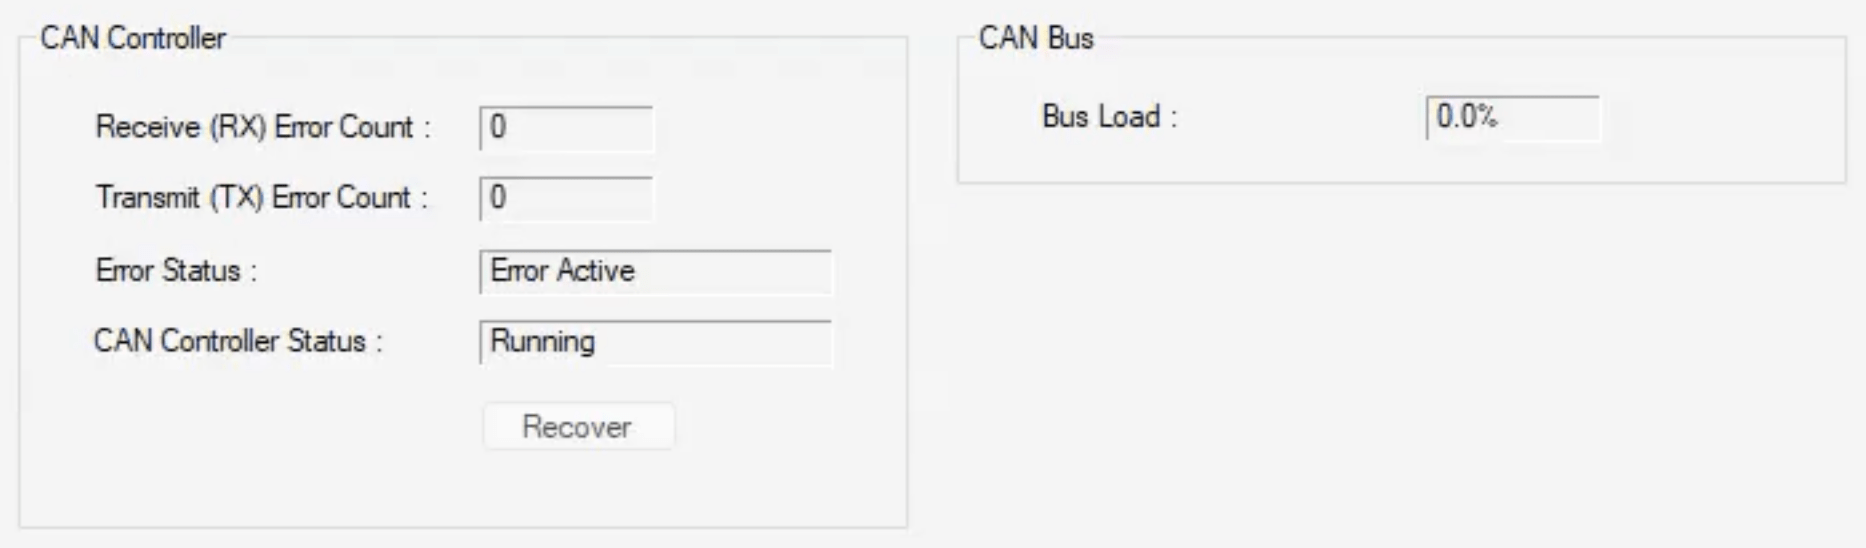
The receive (Rx) and transmit (Tx) error counters can be difficult to interpret. They are part of the CAN controller’s internal error management system, and the CAN protocol defines when and by how much each counter changes. To make sense of the readings, it helps to understand how the controller handles errors during transmission and reception.
I’ll cover these rules in more detail in an update to the JCOM1939 Monitor User Manual. In upcoming articles on this site, I’ll show how the counters change under different network conditions and how you can use those changes to troubleshoot communication problems.
Silent Mode for passive monitoring
Silent Mode, also known as listen-only mode, lets the monitor receive and record traffic on a running J1939 network. In this mode, the monitor leaves arbitration and frame acknowledgments to the other nodes on the bus.
To enable it, select Silent Mode in ECU Setup before starting the CAN interface. When you need to send a request, claim an address, or simulate an ECU, start the interface in normal mode.

There’s one detail worth keeping in mind on the bench. If your setup consists of a single transmitting ECU and a monitor in Silent Mode, there’s no active receiver to acknowledge the ECU’s frames. The ECU can report acknowledgment errors and retry its transmissions. Adding another active CAN node gives the ECU a receiver while the monitor stays passive.
Release availability
Both features are included in the next release of the JCOM1939 Monitor. I have also updated the user manual to cover the status indicators, explain what the error counters show, and document how to enable Silent Mode.
Please be aware that the updated Windows software also requries an updated gateway firmware.